Below are the steps in creating a custom report. We will use a report of members that are over 60 years old as an example.
1. Click Custom Reports in Dashboard page.
2. Under Create Filters>>New Filters section, select the type of report/data that you like to generate. In this example, we will use 'Membership'.
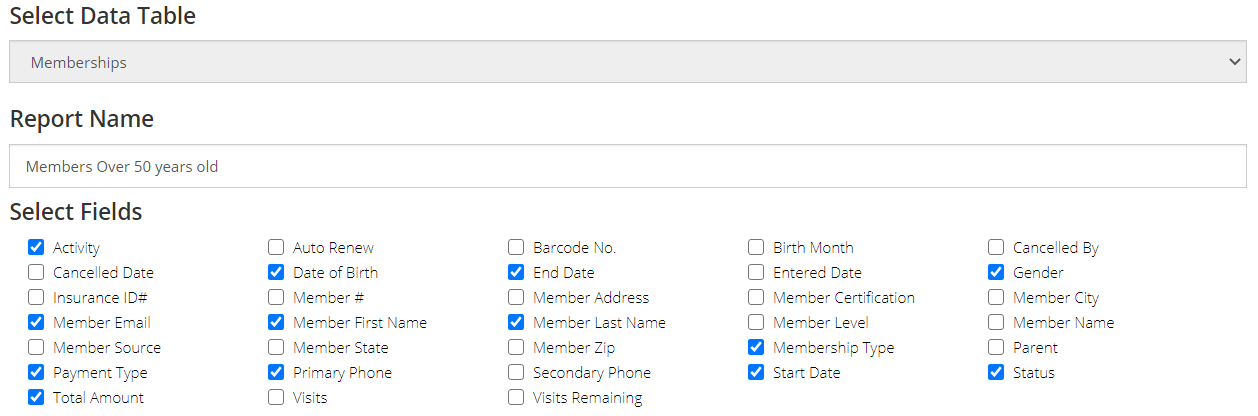
3. Create a specific name of the report (ie, Members over 50 years old) in Report Name field.
4. Select the columns you like to include under the Select fields section. Please see example below.
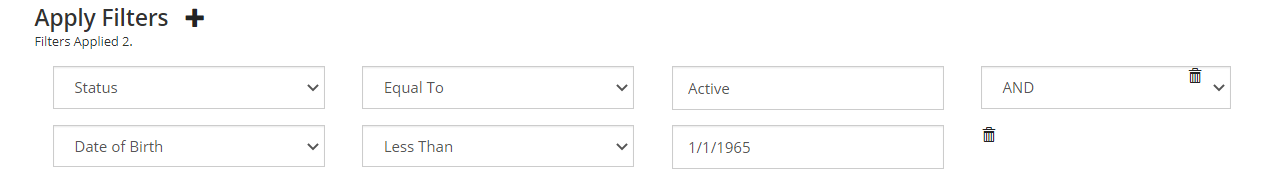
5. Add filters by clicking the + sign in Apply Filters and selecting the applicable options. Please see example below.
6. Click Save report. Your custom report would then be generated and you will have the options to print PDF's, export to Excel, print labels, download mail merge file, export email or send email blast.

You can view your saved custom reports in Saved Filters page and update if and when needed.
1. Click Custom Reports in Dashboard page.
2. Click Saved Filters link.

The Saved Filters page will show you all the custom report filters that you have created in the past. You will have the option to update each saved filter by clicking the custom filter itself and clicking Update Report at the buttom after making the changes, to view the updated report, simply click the View Report button which will also give you the options to print PDF's, export to Excel, print labels, download mail merge file, export email or send email blast. If you wish to delete a filter, simply click Delete Filter on the right side.
QuikChek Cloud has the ability to send email blast to the members from a generated custom report. Should you wish to enable this option, please call 954-575-7160 for more info. Please refer to Create a custom report and View saved custom report filters for instructions. Once the report is generated click the Send Emails button on the upper right side of the screen.
A top ten list can be generated for the following:

1.Click Custom Graphs under Dashboard
2. Select the site in Site field
3. Select duration for any of the following: